
Sharpe Ratio: Is Your Strategy Actually Good?
If you've ever looked at a trading strategy and wondered, "Is this actually good, or did it just get lucky?" — the Sharpe ratio is your answer.
Professionals use it religiously. Institutional investors demand it. Why? Because the Sharpe ratio tells you exactly how much return you're getting for the risk you're taking.
1. What is the Sharpe Ratio?
The Sharpe ratio, developed by Nobel laureate William F. Sharpe, measures the excess return per unit of risk (volatility) in an investment or trading strategy.
2. The Formula: Risk-Adjusted Returns Explained
Example: 20% return, 4% risk-free rate, 10% standard deviation = 1.6 Sharpe ratio.
3. What is a "Good" Sharpe Ratio?
| Sharpe Ratio | Interpretation | Example |
|---|---|---|
| < 0.5 | Poor | High-risk crypto, many retail traders |
| 0.5 – 0.99 | Average | Most hedge funds, typical retail |
| 1.0 – 1.49 | Good | Professional trend-following funds |
| 1.5 – 1.99 | Excellent | Top-tier hedge funds, elite traders |
| > 2.0 | Exceptional | Rare — systematic quant strategies |
For retail traders, aiming for a Sharpe ratio of 1.0–1.5 is realistic and admirable.
4. Why Sharpe Ratio Matters More Than Total Return
Strategy A: 50% return, 35% volatility = 1.31 Sharpe. Strategy B: 25% return, 10% volatility = 2.10 Sharpe. Strategy B is the better strategy.
5. How to Apply Sharpe Ratio to Your Trading
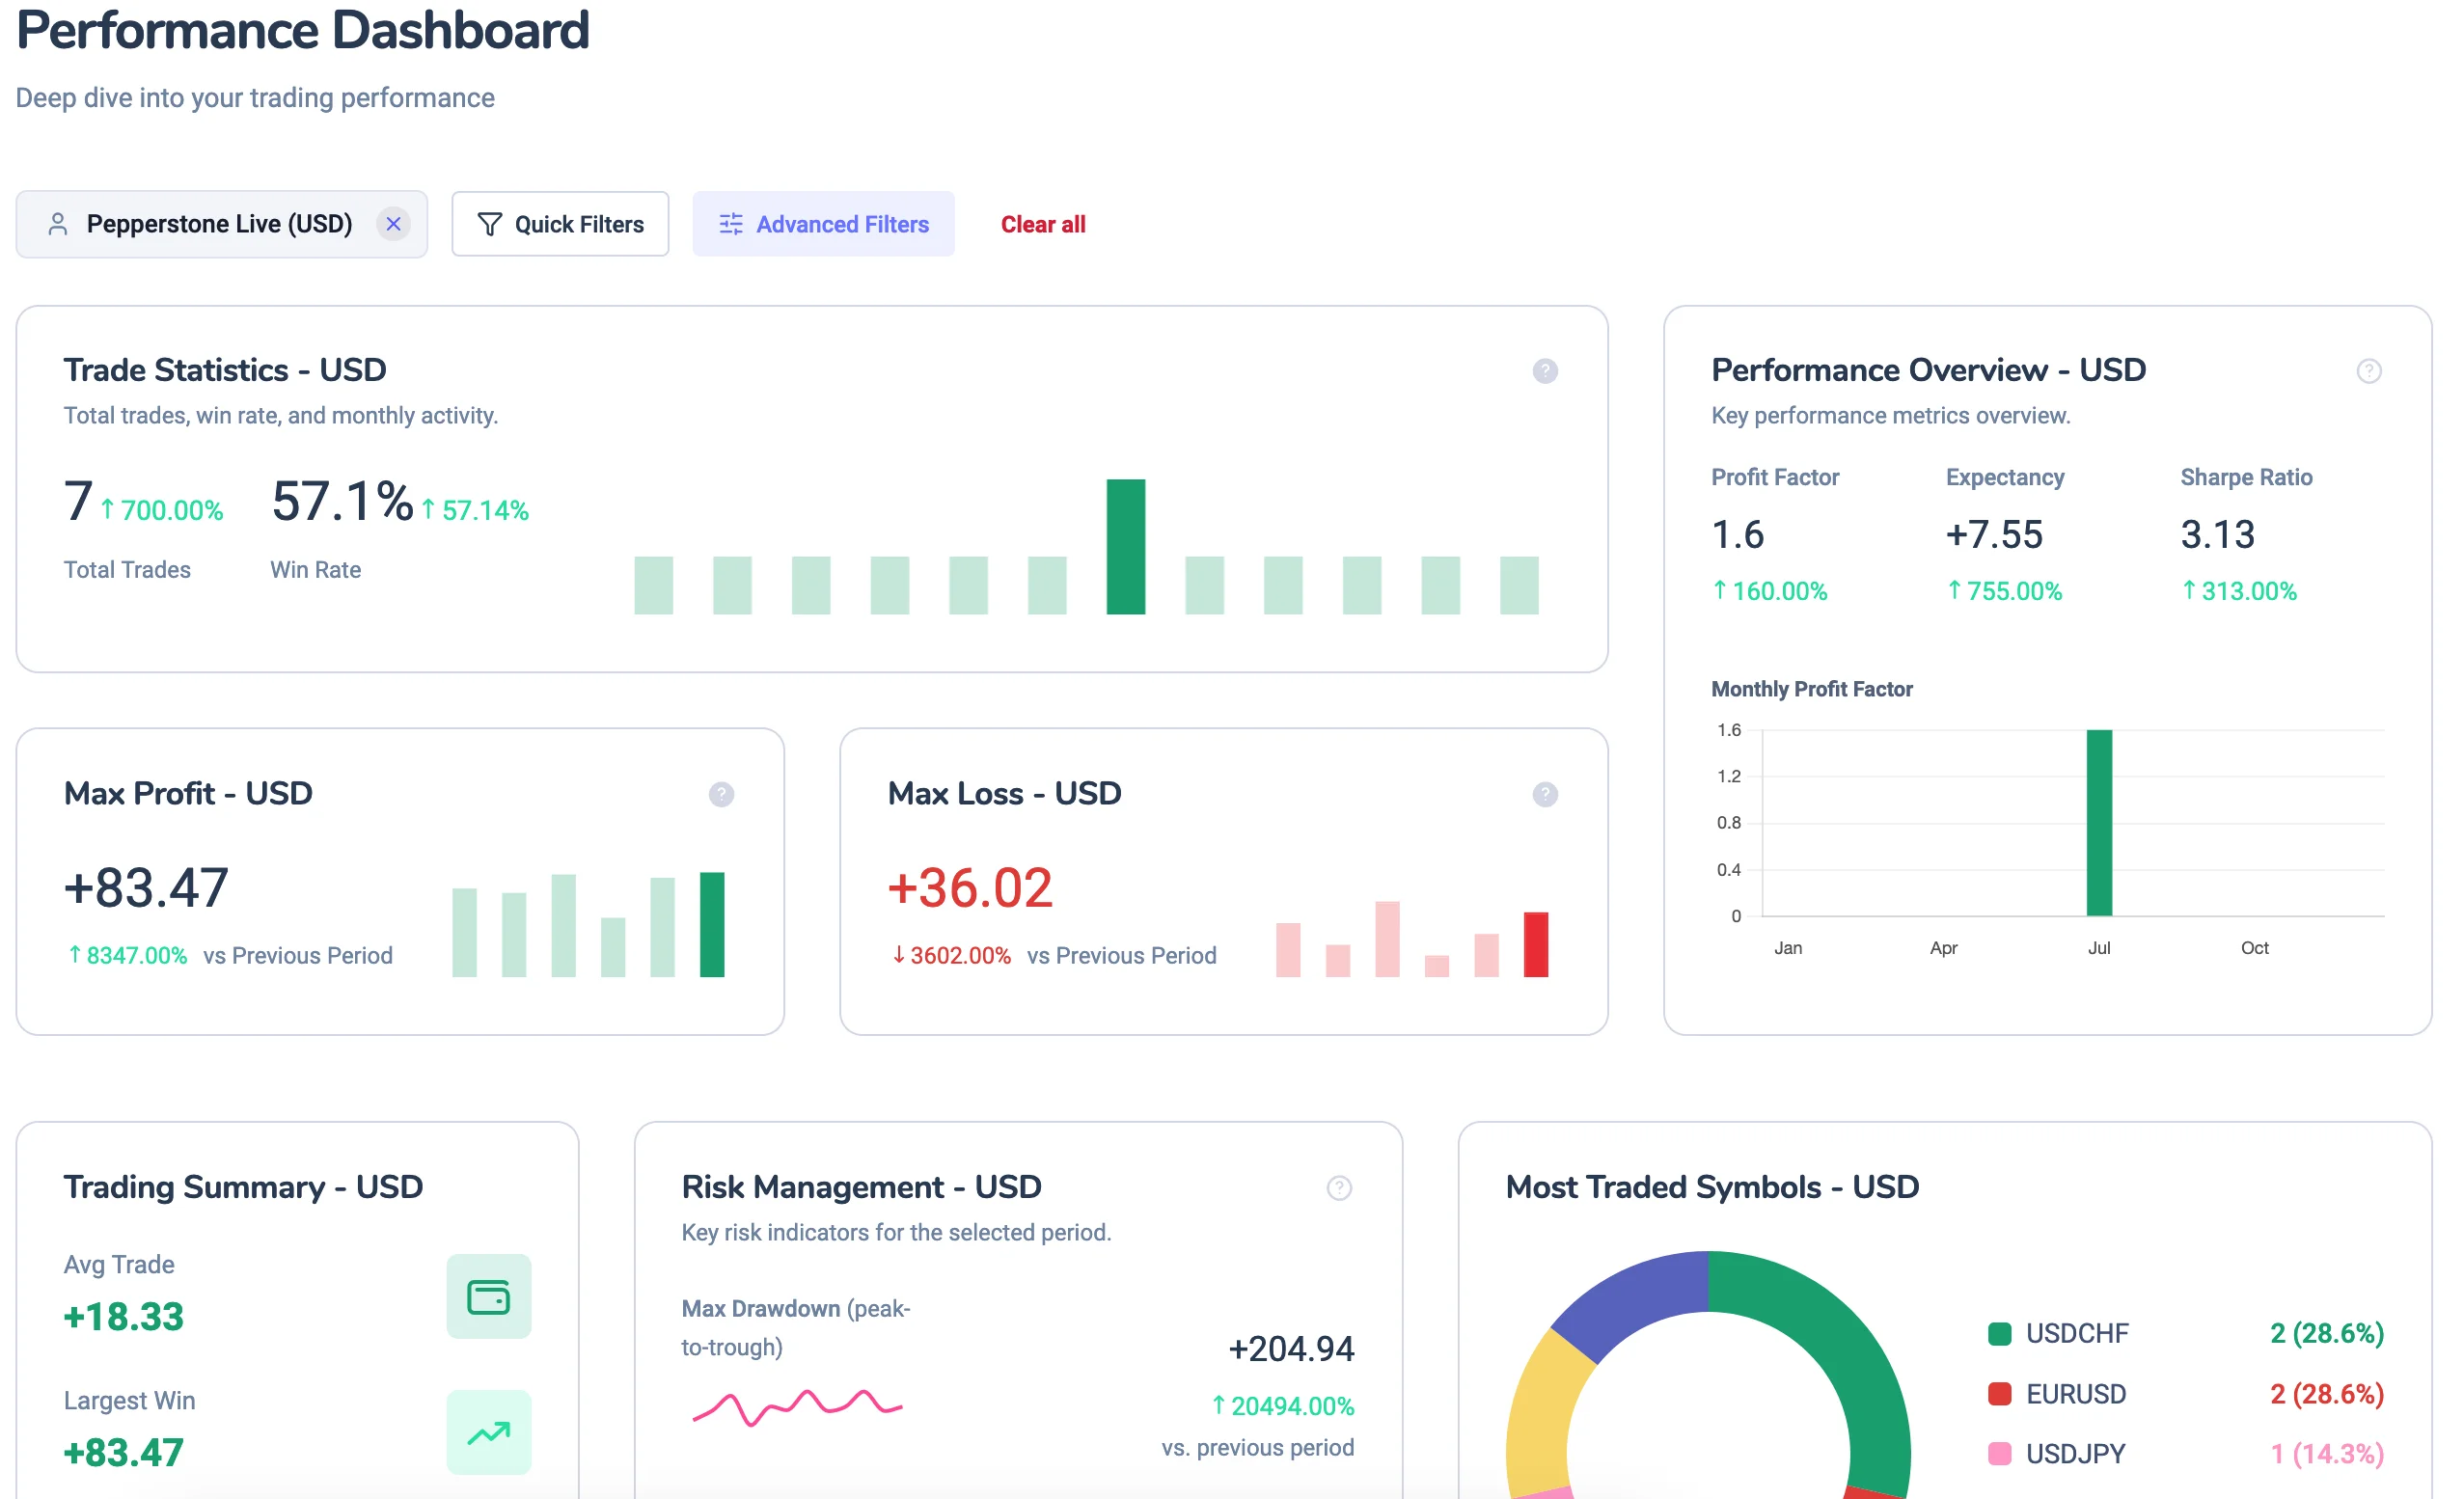
Track your Sharpe ratio monthly or quarterly. Laxarr's analytics dashboard automatically computes it for you. Use it to compare strategies and identify weak spots.
6. Limitations of the Sharpe Ratio
It assumes normal distribution, doesn't differentiate between upside and downside volatility, and is based on historical data.
Conclusion: The Professional's Compass
The Sharpe ratio is the compass that separates professional traders from amateurs. It forces you to think not just about how much you're making, but how you're making it.
Ready to track your Sharpe ratio automatically?
Laxarr's analytics dashboard automatically calculates your Sharpe ratio from your journal data.
View your analytics